ConnectSense Smart Power Cord on the AWS Cloud - Operational Guide
Quick Start Operational Guide


January 2022
Gary Marrs and Paco Rodríguez, Grid Connect
Carlos Lemus and Justin Courtright, Trek10
Irshad Buchh, AWS SI Partner Management team
| Visit our GitHub repository to view source files, report bugs, submit feature ideas, or post other feedback on this Quick Start. To comment on the documentation, see Feedback on this guide. |
This Quick Start was created by Grid Connect and Trek10 in collaboration with Amazon Web Services (AWS). Quick Starts are automated reference deployments that use AWS CloudFormation templates to deploy key technologies on AWS, following AWS best practices.
Overview
After you’ve deployed the ConnectSense Smart Power Cord Quick Start, you must retrieve the API Gateway URL and API key so that you can configure your SPC. After you retrieve these values, you use them to connect any SPC to the IoT endpoint, as described in the following sections.
Create an Amazon QuickSight dashboard
You can use Amazon QuickSight to create a dashboard to visualize the metrics from the connected SPC. Follow these steps to set up a dashboard for visualizing the watts used by the connected SPC over time.
-
From the AWS Management Console, open the QuickSight console.
-
Choose New Analysis, New Dataset, AWS IoT Analytics.
-
Choose the AWS IoT Analytics dataset that was created by your stack named
ConnectSenseQuickstartDataset. -
Choose Create data source, Visualize.
-
In the Visual types panel, choose Line Chart.
-
Choose Field wells at the top to expand the panel of field wells, as shown in Field wells.
 Figure 1. Field wells

-
From the Fields list, drag the datetime label into the X axis field well. Choose the down arrow next to
datetime (MINUTE), and for aggregate, choose minute. -
From the Fields list, drag the watts label into the Value field well. Choose the down arrow next to
watts (Median), and for aggregate, choose average. -
From the Fields list, drag the thing_name label into the Color field well.
Your field wells now look something like Field wells with units.
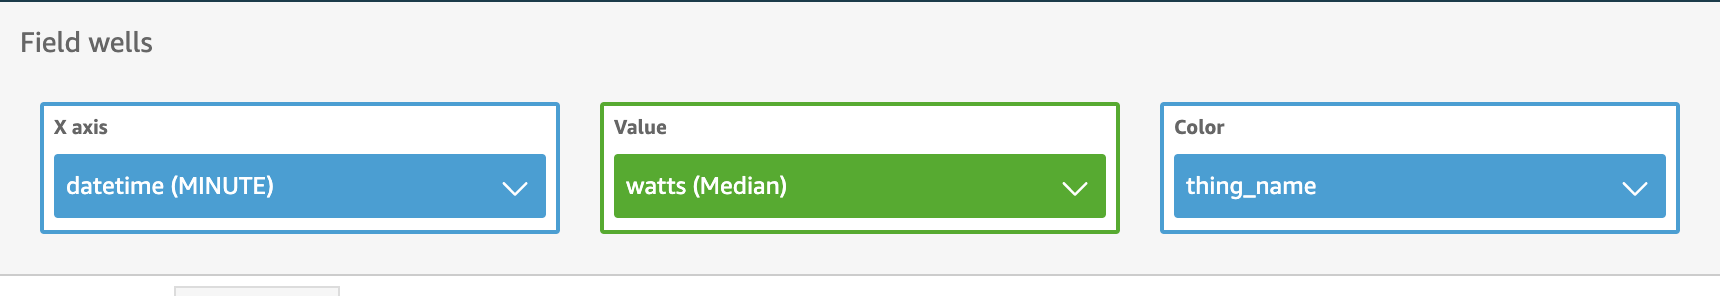 Figure 2. Field wells with units
You now see the watts plotted something like QuickSight data visualization:
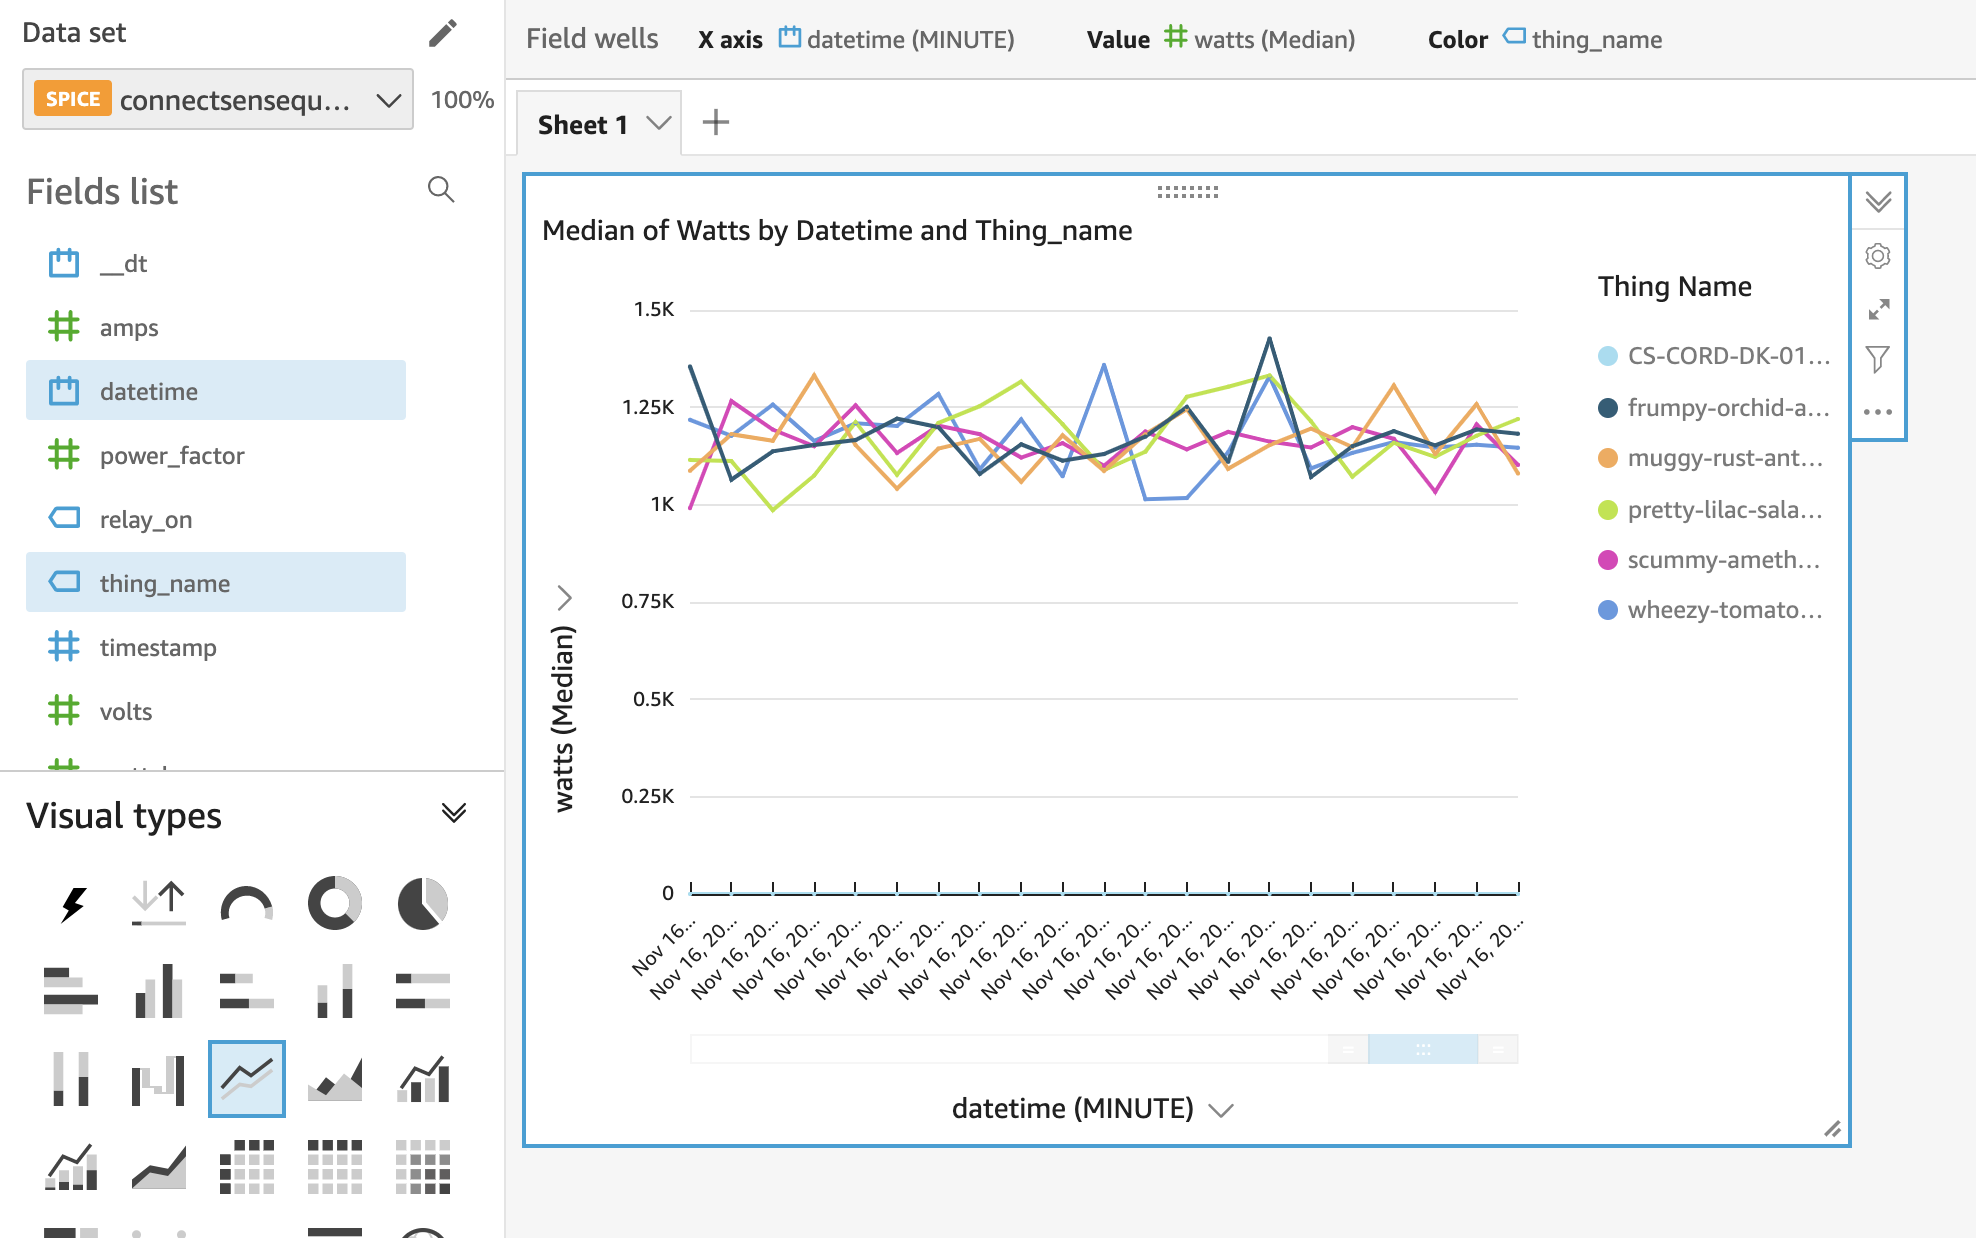 Figure 3. QuickSight data visualization


| To grant QuickSight access to AWS IoT Analytics, see Visualizing AWS IoT Analytics data with Amazon QuickSight. |
Feedback on this guide
To comment on this guide, open a GitHub issue as follows:
Notices
This document is provided for informational purposes only. It represents AWS’s current product offerings and practices as of the date of issue of this document, which are subject to change without notice. Customers are responsible for making their own independent assessment of the information in this document and any use of AWS’s products or services, each of which is provided “as is” without warranty of any kind, whether expressed or implied. This document does not create any warranties, representations, contractual commitments, conditions, or assurances from AWS, its affiliates, suppliers, or licensors. The responsibilities and liabilities of AWS to its customers are controlled by AWS agreements, and this document is not part of, nor does it modify, any agreement between AWS and its customers.
The software included with this paper is licensed under the Apache License, version 2.0 (the "License"). You may not use this file except in compliance with the License. A copy of the License is located at http://aws.amazon.com/apache2.0/ or in the accompanying "license" file. This code is distributed on an "AS IS" BASIS, WITHOUT WARRANTIES OR CONDITIONS OF ANY KIND, either expressed or implied. See the License for specific language governing permissions and limitations.